DATA INTEGRITYRED
Market-data connections require review.
WelDNA Intelligence · CAEDA™
System Health / Validation Gate
Live public-market signals inform the view. Human judgment, validation, and approval control every consequential decision.
Market-data connections require review.
Early warning. Review financing, valuation, and exit assumptions.
Trading-zone estimates are stopped.
Human-managed · AI-augmented · Business-governed
Collaborate → Accumulate → Evaluate → Deliberate → Articulate. Market signals become a decision only after evidence, ownership, and human review. This governance view applies across every market group; it does not grade trades or provide buy/sell signals.
Equal-weight daily move across the listed private-equity signal group.
Risk trigger: Yellow ≥20 · Amber ≥25 · Red ≥35
Financing-cost proxy for leverage and refinancing pressure.
Daily risk-appetite signal for leveraged transactions.
USD per troy ounce · TradingView/OANDA. View quote
USD per troy ounce · TradingView/OANDA. View quote
WelDNA Estimated Trading Zone v1.0
Twenty-session ranges combine validated price history, support and resistance, 20/50/200-day averages, RSI and ATR volatility. Human review remains required.
These are mathematical monitoring ranges, not guaranteed entry, exit, profit, or stop-loss prices. They do not constitute investment advice or authorization to trade.
Live Market Action
The analytical quote cards are currently unavailable. Use the live chart below while the system continues to retry.
Interactive Market Chart
Interactive chart provided by TradingView. Availability and exchange delay depend on the instrument and data agreement.
Decision Lens
Watch Treasury yields and HYG together. Rising yields plus falling high-yield prices can narrow debt capacity.
SPY and small-cap movement help frame public-market appetite, valuation support, and timing pressure.
XLE and industrial proxies highlight sectors where operational discipline, capital controls, and integration support may be needed.
Failsafe Triggers
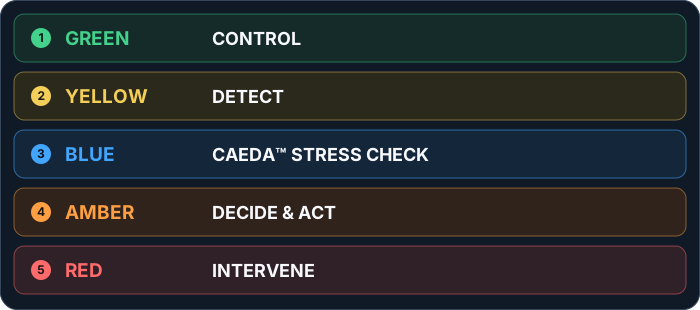
Management response states, separate from the estimated trading-zone grades.
CONTROL. Continue monitoring and execute approved work.
DETECT. Review emerging financing, valuation, and exit signals.
CAEDA™ STRESS CHECK. Hold, test the evidence and assumptions, and choose a corrective path.
DECIDE & ACT. Assign an owner, approve the response, and tighten controls.
INTERVENE. Restrict consequential action and execute contingency plans.